Live Pilot Results
Demonstrating the Alpha Premium in Real-World Market Conditions
Theoretical models must survive contact with live markets. We partner with asset managers through a rigorous 6-month pilot program. Using our deep financial market experience and proprietary model factory, we systematically identify the strengths and minimise the structural weaknesses in the original strategy.
The primary objective is not merely to amplify returns, but to structurally reshape portfolio return distributions by eliminating downside volatility.

Pilot Diagnostics: Comparative Performance
The following data reflects live pilot programs comparing the original benchmark strategies (Standard) against the exact same portfolios wrapped in our technology (Modelomni).
Performance is contrasted across two distinct market environments: the initiation phase (Nov/Dec 2025) and a subsequent challenging market period (Feb/Mar 2026).
Actively Managed Eurozone Large Cap
A portfolio pairing stable, defensive dividend-payers with highly cyclical value and high-beta growth stocks
| Metric | Nov/Dec '25 (Standard) | Nov/Dec '25 (Modelomni) | Feb/Mar '26 (Standard) | Feb/Mar '26 (Modelomni) |
|---|---|---|---|---|
| Return in Period | 3.9% | 5.3% | -3.4% | 7.3% |
| Max Drawdown | 4.8% | 2.4% | 9.1% | 1.3% |
| Sharpe Ratio | 2.3 | 5.5 | -2.1 | 5.3 |
Concentrated Global Thematic Fund
A decarbonisation and grid modernisation portfolio, heavily concentrated in the industrials, materials, and utilities sectors
| Metric | Nov/Dec '25 (Standard) | Nov/Dec '25 (Modelomni) | Feb/Mar '26 (Standard) | Feb/Mar '26 (Modelomni) |
|---|---|---|---|---|
| Return in Period | -3.6% | -0.8% | -0.2% | 15.8% |
| Max Drawdown | 10.8% | 2.8% | 10.0% | 1.8% |
| Sharpe Ratio | -2.1 | -1.5 | -0.4 | 5.6 |
Concentrated Switzerland Index Fund:
A highly concentrated index portfolio heavily anchored by global defensive stalwarts and high-margin
| Metric | Nov/Dec '25 (Standard) | Nov/Dec '25 (Modelomni) | Feb/Mar '26 (Standard) | Feb/Mar '26 (Modelomni) |
|---|---|---|---|---|
| Return in Period | 3.6% | 5.0% | -1.0% | 4.0% |
| Max Drawdown | 5.0% | 6.1% | 5.7% | 9.0% |
| Sharpe Ratio | 2.2 | 2.8 | -0.4 | 0.9 |
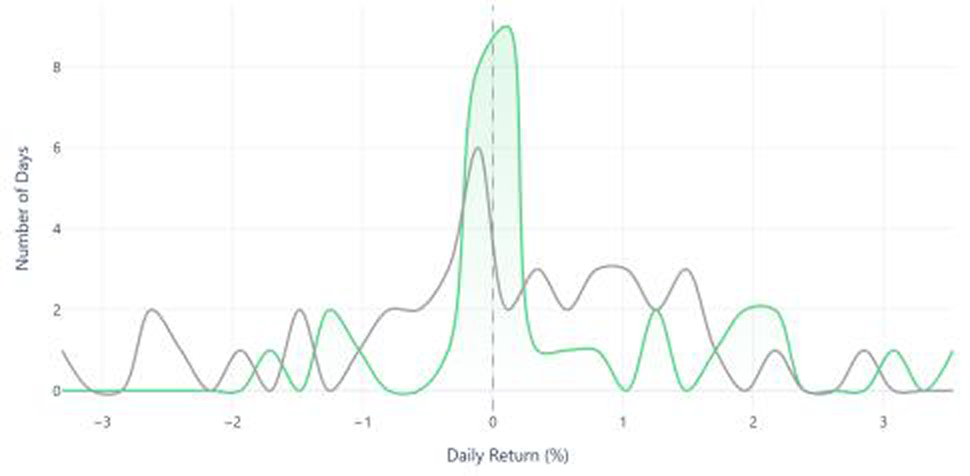
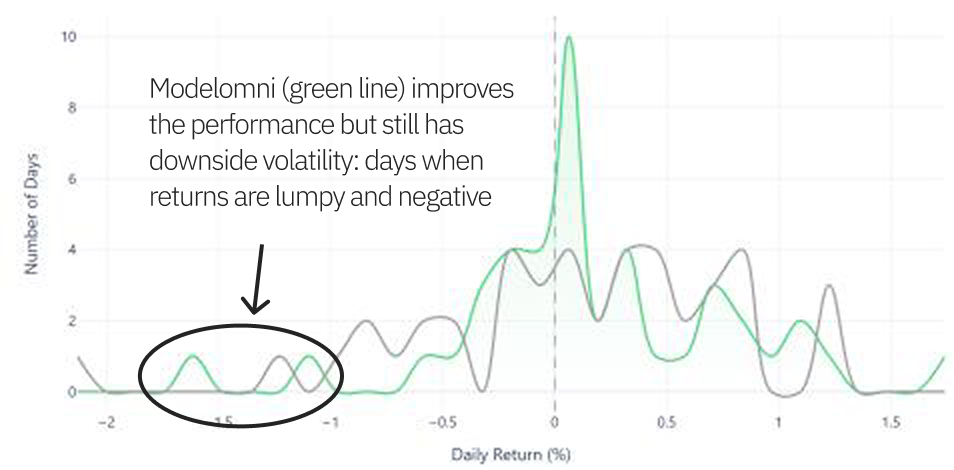
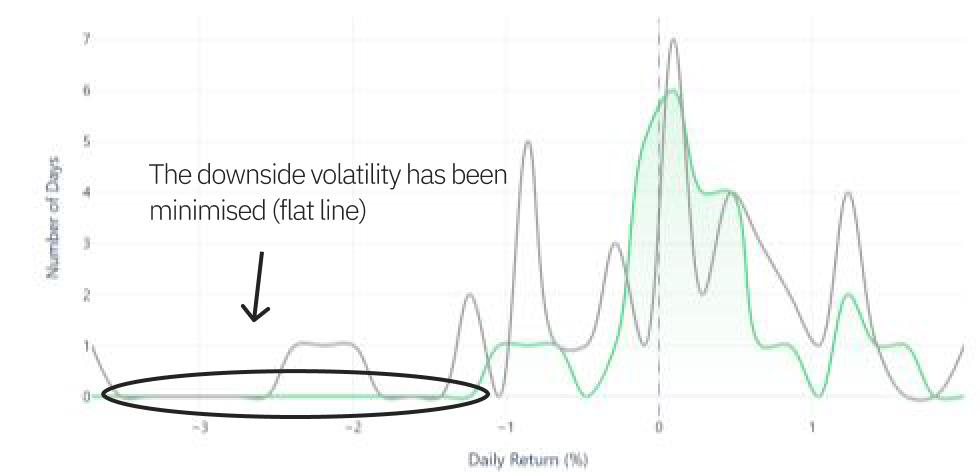
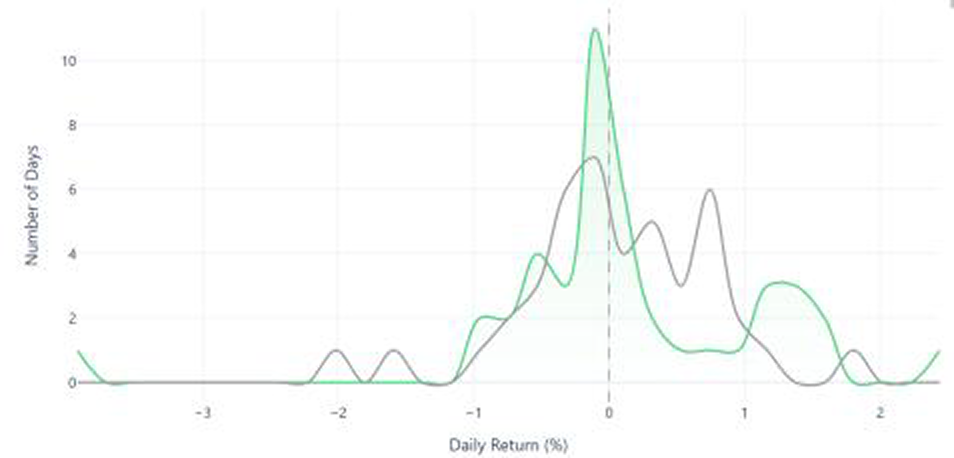
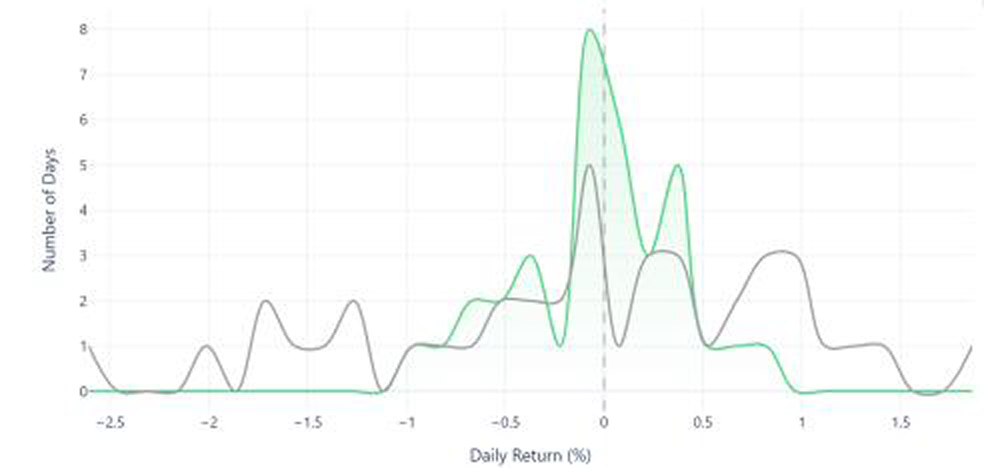
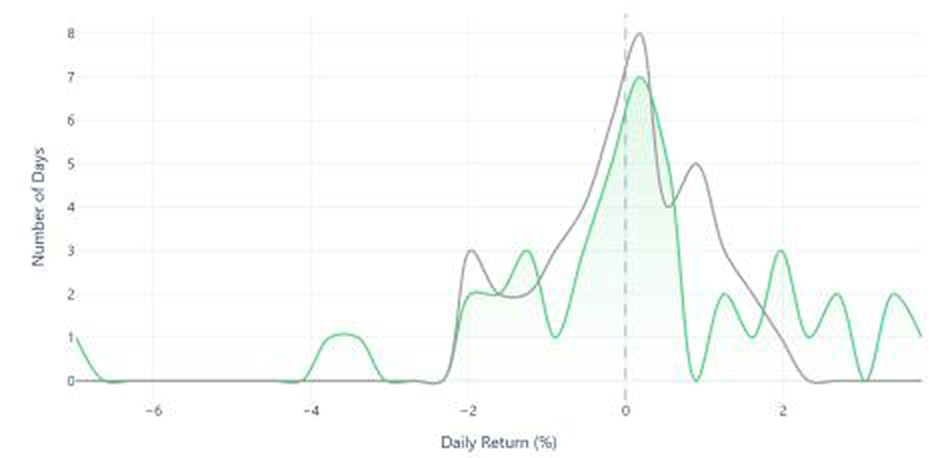
Traditional strategies suffer from “lumpy and negative” returns during market stress. As visualised in the distribution charts above, the Modelomni intervention systematically flattens the left tail of the return distribution. By exiting the market during periods of structural weakness, downside volatility is effectively eliminated (represented by the flat green line), creating true convexity.
Live Pilot Program Results
We work with asset managers, in a process over 6 months, to address these challenges by structurally reshaping their portfolio return distributions using our experience of financial markets and our ‘model factory’ for creating machine learning models that perform in real world market conditions.
These are 3 examples of how Modelomni finds the strengths and eliminates the weaknesses in the original strategy. These charts compare performance at the start of the process (Nov/Dec 2025) and at the end (Feb/Mar 2026 – a challenging two months for all portfolios). Modelomni performance is in green, and the original strategy is in grey.
1. A balanced actively managed fund (TD12)
A Eurozone large cap portfolio that pairs stable, defensive dividend-payers with highly cyclical value and high-beta growth stocks
Nov/Dec 2025
Feb/Mar 2026
2. An index fund (TD22)
A highly concentrated, Switzerland-only index portfolio heavily anchored by global defensive stalwarts (healthcare and consumer staples) and high-margin industrials
Nov/Dec 2025
Feb/Mar 2026
3. A global thematic fund (TD23)
A decarbonisation and grid modernisation portfolio concentrated in the industrials, materials, and utilities sectors
Nov/Dec 2025
Feb/Mar 2026